From Institut Sant Pol de Mar
We apologize not to share the species document, so we send to you this work and we wish it is useful for you.
Thank you all for your work. Your data have been interesting for our learning.
Thank you Carol to create this wonderful project.
https://docs.google.com/presentation/d/1zBV6KZTWTfCa1yqqPC-J2woJGrwU7GNgoF0neVIW1AU/edit?ts=5937da9b#slide=id.g226c531830_0_5

Friday, 16 June 2017
Thursday, 8 June 2017
Marine species from Arenys de Mar
Hello!!! We are from Jaume Almera institute, and here is our presentation of the 10 most captured species in Arenys de Mar.
https://magic.piktochart.com/output/22187434-especies-dinteres-comercial-bertaannaaina-i-abril
Tuesday, 6 June 2017
Tuesday, 30 May 2017
CONGRATULATIONS and see you at sea!!!
Hello!!!

And it has been fantastic to know your ‘marine menu’. So some of you love red shrimps but others only have fish. Definitely I will not be eating every day the same thing with you!
I'm now having fun with your audioguides. And looking forward to seeing the rest of your data. You can still post them before the end of June!

First of all I would like to congratulate you for all the hard work. WELL DONE!!!
You have done lovely presentations to introduce yourselves and showed us a little about the bit of ocean that you enjoy!
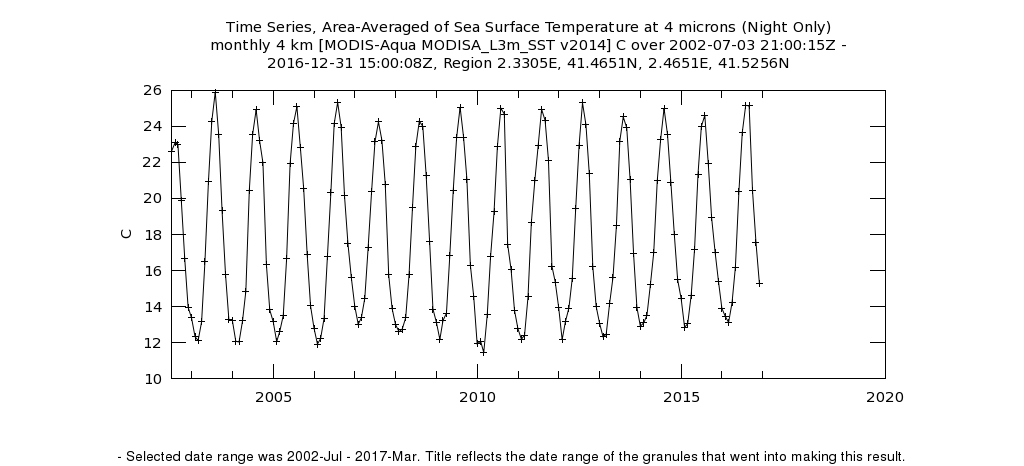
Now we know that the Sea Surface Temperature (SST) is not even. Compared to previous years in some cases it has been warmer and in others colder. Latitude has been determinant to find such warm water in Taiwan compared to the rest. But the Kuroshio current has made the temperature at Jin Shan Zui very similar to the values found in the Mediterranean sea, although it's further North!
No schools managed to measure the Secchi depth, but it is an important measure to know indirectly how much plankton there is in the water. Remember that plankton is the base of the marine food chain.
And yes, thanks to the marine currents you have described, we can really talk about one single Ocean that we all share!!!
The sand can have very different colours. And you've experimented that different grain size produces different beach profiles!
And it has been fantastic to know your ‘marine menu’. So some of you love red shrimps but others only have fish. Definitely I will not be eating every day the same thing with you!
I'm now having fun with your audioguides. And looking forward to seeing the rest of your data. You can still post them before the end of June!
Thank you so much for your collaboration!!!!
See you at sea!
Sharky
Friday, 19 May 2017

Wednesday, 17 May 2017
Audioguide (activity 5)
Hello!

While you are finishing off the infographic of the marine species we are moving on to the last activity of the Oceans project: the audioguide!
Activity nº 5: Audioguide
Objective: create an itinerary of the 'Fish Route', specifying the location of the fishing grounds, port, fish market and other information of your interest!
ICT suggested: Eduloc >> or Genially >> (although Genially is not exaclty an audioguide programme you can create an interactive map with it too!)
Source of data:
Label of the post: audioguide
All the best!
Sharky

While you are finishing off the infographic of the marine species we are moving on to the last activity of the Oceans project: the audioguide!
Activity nº 5: Audioguide
Objective: create an itinerary of the 'Fish Route', specifying the location of the fishing grounds, port, fish market and other information of your interest!
ICT suggested: Eduloc >> or Genially >> (although Genially is not exaclty an audioguide programme you can create an interactive map with it too!)
Source of data:
- Survey you have already done
- Internet
Label of the post: audioguide
Deadline to complete the form: 29th May
Suggestion: We recommend working in teams, where every group is in charge to look up different kinds of information or different locations in your route.
Please remember only one audioguide per class!Suggestion: We recommend working in teams, where every group is in charge to look up different kinds of information or different locations in your route.
All the best!
Sharky
Friday, 12 May 2017
Wednesday, 10 May 2017
Comments from Sharky (The Sand)
Hello!

I see you've been having fun with the sand. Thank you for sharing it on the blog!
Now, let's see what have you found out...


How nice to see that all your beaches are so different and colourful! And sorry to hear you have some plastic mix in it too. More than once I've got a fright with some plastic bags, yuck!
You've done a good job analysing the origin of the sand, the shape of your beach and the effect of man structures. And especial congratulations for IES Jaume Almera for their discussion about artificial beaches. You've got it right! On an artificial beach the sand is not so compact. The reason is that the sand has not undergone the selection that natural forces such as wind and waves do. Even having finer sand, the grains are more disorganised, there are more empty spaces among them so the action of the waves will be more effective, making beach faces steeper and taking the sand away.
Hmmm... This is interesting, all of you have similar heaps of sand and the inclination of the beach face is the same except for IES Ramon Berenguer IV. Their sand has similar size, so how is it possible that the beach face is almost flat?
All participating schools are invited to answer on this same post, just press on the 'No comments/comments' link!
Looking forward to your comments, you are doing GREAT!
Sharky
I see you've been having fun with the sand. Thank you for sharing it on the blog!
Now, let's see what have you found out...
You've done a good job analysing the origin of the sand, the shape of your beach and the effect of man structures. And especial congratulations for IES Jaume Almera for their discussion about artificial beaches. You've got it right! On an artificial beach the sand is not so compact. The reason is that the sand has not undergone the selection that natural forces such as wind and waves do. Even having finer sand, the grains are more disorganised, there are more empty spaces among them so the action of the waves will be more effective, making beach faces steeper and taking the sand away.
Hmmm... This is interesting, all of you have similar heaps of sand and the inclination of the beach face is the same except for IES Ramon Berenguer IV. Their sand has similar size, so how is it possible that the beach face is almost flat?
All participating schools are invited to answer on this same post, just press on the 'No comments/comments' link!
Looking forward to your comments, you are doing GREAT!
Sharky
Tuesday, 2 May 2017
Hello Sharky,
We are INS Lluís Domènech i Montaner and we want to answer your questions about water.
First of all, we must say that we gathered water temperature the 31st of january. It was very cold and some days before it was so, so cold that our pond was frozen.


We are INS Lluís Domènech i Montaner and we want to answer your questions about water.
First of all, we must say that we gathered water temperature the 31st of january. It was very cold and some days before it was so, so cold that our pond was frozen.


And about climate change, we think that it is not going to be the same everywhere. As our ocean is interconnected with lots of sea currents going from North to South, there will be places where temperature will we lower as well als there will be some places where temperature will we higher.
Tuesday, 25 April 2017
Marine species (activity 4)
Hello!
 While you are finishing off activity nº3 the Sand, we are moving on to the next activity.
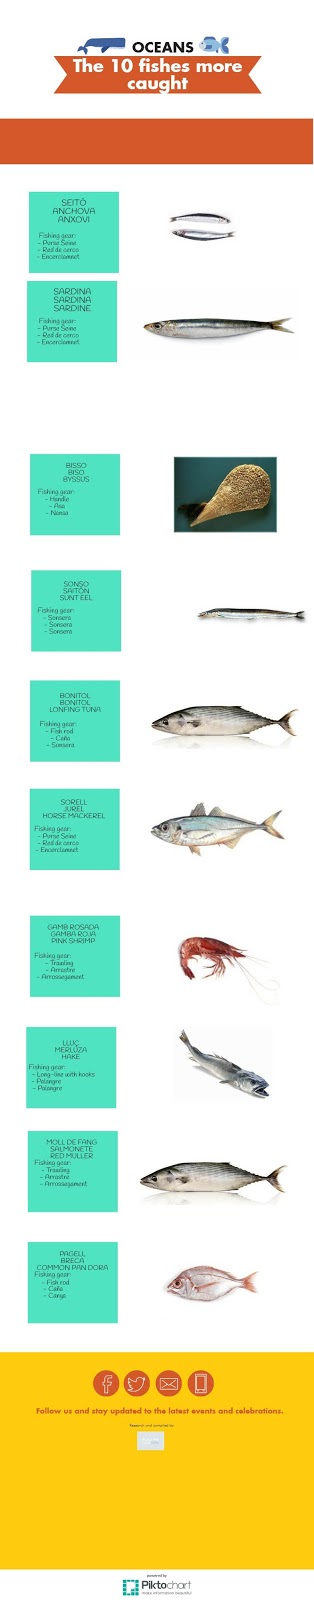
Activity nº 4: Marine species
Objective: create an infographic of the 10 most important species caught by the fishermen of your closest port using the ICT Piktochart >>
You will have to create an account, sign in, choose the option infographic, scroll down, choose the first template (Create your own infographic) and start editing.
Information included in the infographic:
An infographic is made by blocks, in the first block put the Title and Authors.
In the following blocks you will describe the marine species with the following information:
- Photo or some kind of illustration that allows its identification
-Common name in the local language
-Common name in English (only if local language is not English)
-Scientific name
In the last block put two graphs:
-Percentage that each species represents of the annual turn over
-Percentage that each species represents of tonnes captured annually
You can add any other information of YOUR INTEREST!
Once you have finished you can publish it and post the link provided by Piktochart on this blog to share it!
Source of data:
Looking forward to know the food I can have in your area, yummy!
All the best!

Activity nº 4: Marine species
Objective: create an infographic of the 10 most important species caught by the fishermen of your closest port using the ICT Piktochart >>
You will have to create an account, sign in, choose the option infographic, scroll down, choose the first template (Create your own infographic) and start editing.
Information included in the infographic:
An infographic is made by blocks, in the first block put the Title and Authors.
In the following blocks you will describe the marine species with the following information:
- Photo or some kind of illustration that allows its identification
-Common name in the local language
-Common name in English (only if local language is not English)
-Scientific name
In the last block put two graphs:
-Percentage that each species represents of the annual turn over
-Percentage that each species represents of tonnes captured annually
You can add any other information of YOUR INTEREST!
Once you have finished you can publish it and post the link provided by Piktochart on this blog to share it!
Source of data:
- Survey at the port
- Internet
(Teachers will supply you with the information about the survey, webpages and tutorial of Piktochart)
Label of the post: species
Label of the post: species
Deadline to complete the form: 15th May
Suggestion: We recommend working in teams, where every group is in charge to look up different kinds of information.
Please remember only one infographic per class!Suggestion: We recommend working in teams, where every group is in charge to look up different kinds of information.
Looking forward to know the food I can have in your area, yummy!
All the best!
Sharky
Wednesday, 12 April 2017
Comments from Sharky (the Water)
Hi!

I'm happy to see so much progress! And thank you so much for your photos!!!!
So let's see your water data (update 5th May) :
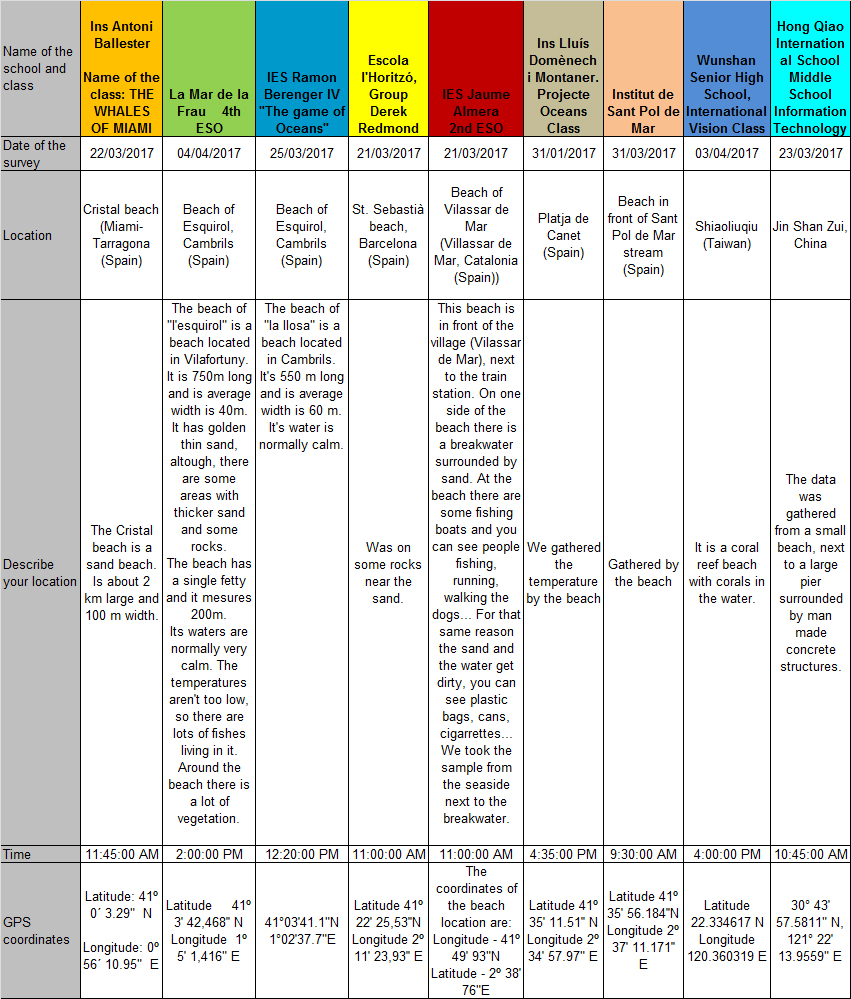


The order of participating schools is from West to East so we can all follow easily the changes in your data.
Ups! I'm afraid that IES Jaume Almera has got a bit confused with the coordinates. Could you send the corrected ones please? (Just leave a comment on this post. Thanks!)
Oh! And the students of the Wunshan Senior High School have sailed to another island, NICE! Did you enjoy the trip?
Hmmmm... I'm also sorry to see that Wunshan Senior High School had problems retrieving the satellite Sea Surface Temperature (SST) data from NASA's webpage. I'll send further information to your teacher if you want to give it another try!
And YES!!!!! I agree with you that there's just one ocean interconnected.
Ok, now let me ask you a couple of questions:
1. Can you tell why the temperature gathered by the Ins Domènech i Muntaner is much lower than neighbouring schools?
2. None of you coincide with the years of major and minor SST oscillation. Knowing that the sea has a great influence on the climate, do you think that the climate change is going to be the same around the world?
You can leave your answer using the comment option of the post. Students can also participate individually!
Cheers!
Sharky
I'm happy to see so much progress! And thank you so much for your photos!!!!
So let's see your water data (update 5th May) :
The order of participating schools is from West to East so we can all follow easily the changes in your data.
Ups! I'm afraid that IES Jaume Almera has got a bit confused with the coordinates. Could you send the corrected ones please? (Just leave a comment on this post. Thanks!)
Oh! And the students of the Wunshan Senior High School have sailed to another island, NICE! Did you enjoy the trip?
Hmmmm... I'm also sorry to see that Wunshan Senior High School had problems retrieving the satellite Sea Surface Temperature (SST) data from NASA's webpage. I'll send further information to your teacher if you want to give it another try!
And YES!!!!! I agree with you that there's just one ocean interconnected.
Ok, now let me ask you a couple of questions:
1. Can you tell why the temperature gathered by the Ins Domènech i Muntaner is much lower than neighbouring schools?
2. None of you coincide with the years of major and minor SST oscillation. Knowing that the sea has a great influence on the climate, do you think that the climate change is going to be the same around the world?
You can leave your answer using the comment option of the post. Students can also participate individually!
Cheers!
Sharky
Monday, 10 April 2017
THE WATER
THE WHALES OF MIAMI
INS ANTONI BALLESTER-MIAMI-TARRAGONA
"The name of the beach is Playa Cristal. It is very long. There is fine sand and some small stones. The beach is approximately 50 metres wide from the promenade to the water. At the left extreme of the beach there are rocky cliffs."
41 º 0´ 2.80´´ N
0º 56´10.58´´ E
WATER TEMPERATURE: 15,8 ºC
PHOTOS

EAST VIEW

WET VIEW

SOUTH VIEW

NORTH VIEW

Saturday, 8 April 2017
Atmosphere and Hydrosphere on Sant Pol de Mar

We are the students of 1st eso from the Sant Pol de Mar's highschool.
Every week we study 3 days the atmosphere, hydrosphere, geosphere and biosphere of the beach.
The research zone is located in Sant Pol de Mar at
Latitude 41.59892
Longitude 2.61971
 |
| Looking at Southeast |
 |
| Looking at Northwest |
 |
| Looking at Southwest |
 |
| Looking at Northeast |
 |
| This is our research material. |
Atmosphere and hydrosphere are two fluid systems related and all the changes in one affects on the other. So we consider to study both together to get more data to understand their dynamics.
ATMOSPHERE
Data collected:
- Atmosphere temperature (thermometer)

- Wind Speed (anemometer)


-Wind direction (Compass - Where it comes from)


-Sky cover (0 (no clouds) a 8 (totally covered))

-Cloud classification (Sky watcher chart NOAA)

HYDROSPHERE
-Superficial water temperature (Themometer)


-Description of the Swell and Wind Sea (Direction where it goes)
-Wave frequency (waves/minute)
-Map and Profile of the Beach Research Zone Morphology
(Describing the Berm, Swash zone, Sand Size and other Biology elements)
In the laboratory research, we can see that surface sea temperature water at one of the coldest sea month of the year (March) has increased during the last 10 years more than 1ºC in our research zone.
Now it's time to think about it all together!!

Friday, 7 April 2017
Activity 2
Oceans de la Frau experiences;
Last Tuesday 28th 1 Mach, our class went to the beqacfh. From 13:00pm to 15:00pm we did activities about "The Water". He had to fill up a container with sea water and take data about the water.
We went to the break whater of the "Esquirol beach" (Cambrils, Vilafortuny). We impresed the thermometer tied in a fishing line, 2 metres to calcfulate the temperature of the water during 10 minutes. We repeated the action one more time.Also we took pictures of locations of the beach.
Finally, when we collected all the data we went back to the school.

Another day we did the experiments:
The first experiment was based on showing the diffrerences in density among salty, hot and natural water dyed in different colors with food colorant. The salty water was yelloy, the natural water was blue and the hot water was red.
First, we put some salty water in one tray because is the water with more density. Then we added the natural water and finally we put the hot water, too.
So that way the tray had threee levels of water. On the top one the red, which was hot, in the middlle the natural water which was blue and the last level, at the bottom the yellow water which was salty.
In the second experiment we introduced boiling water in a small glasss and an icecube in another one. After that we put cuater in a bowl and we placed that bowl above the other two small glasses. Then pour the red food colorant drops into the water on the boiling glass and 3 blue drops on the ice, creating a circular motion where the cold water moved down and the boiling above.


Thursday, 6 April 2017
The Water (Sant Sebastià Beach) - Escola l'Horitzó
The name of our beach in Barcelona is Platja de Sant Sebastià. We went there the 21st of March of 2017.
You can see some photos of our beach:


You can see some photos of our beach:


The GPS coordenates are:
Latitude: 41º22'10,57''N Longitude: 2º 11' 23,80''E
Monthly average SST:

Wednesday, 5 April 2017


Monday, 3 April 2017
The Sand (activity 3)
Hello!
Congratulations to those that you have already sent the information. As soon as all participant schools have sent their data, I will put up a table where you will be able to compare the results. I can't wait to see it!!!
In the meantime we are moving on to the next activity.
Activity nº 3: The Sand
Objective: complete the form The Sand >>
Source of data:
Also I would love to see what the beach you are studying looks like! Please post some photos along with the name of the beach, town and GPS coordinates and the graph of the monthly average Sea Surface Temperature. (Label: water). Thank you!!!
All the best!
Sharky
Congratulations to those that you have already sent the information. As soon as all participant schools have sent their data, I will put up a table where you will be able to compare the results. I can't wait to see it!!!
In the meantime we are moving on to the next activity.
Activity nº 3: The Sand
Objective: complete the form The Sand >>
Source of data:
- Survey (you have already done)
- Experiments in the classroom
- Internet
(Teachers will supply you with the information about the experiments and webpages)
Deadline to complete the form: 24th April
Please remember only one form per class!Also I would love to see what the beach you are studying looks like! Please post some photos along with the name of the beach, town and GPS coordinates and the graph of the monthly average Sea Surface Temperature. (Label: water). Thank you!!!
All the best!
Sharky
Subscribe to:
Comments (Atom)